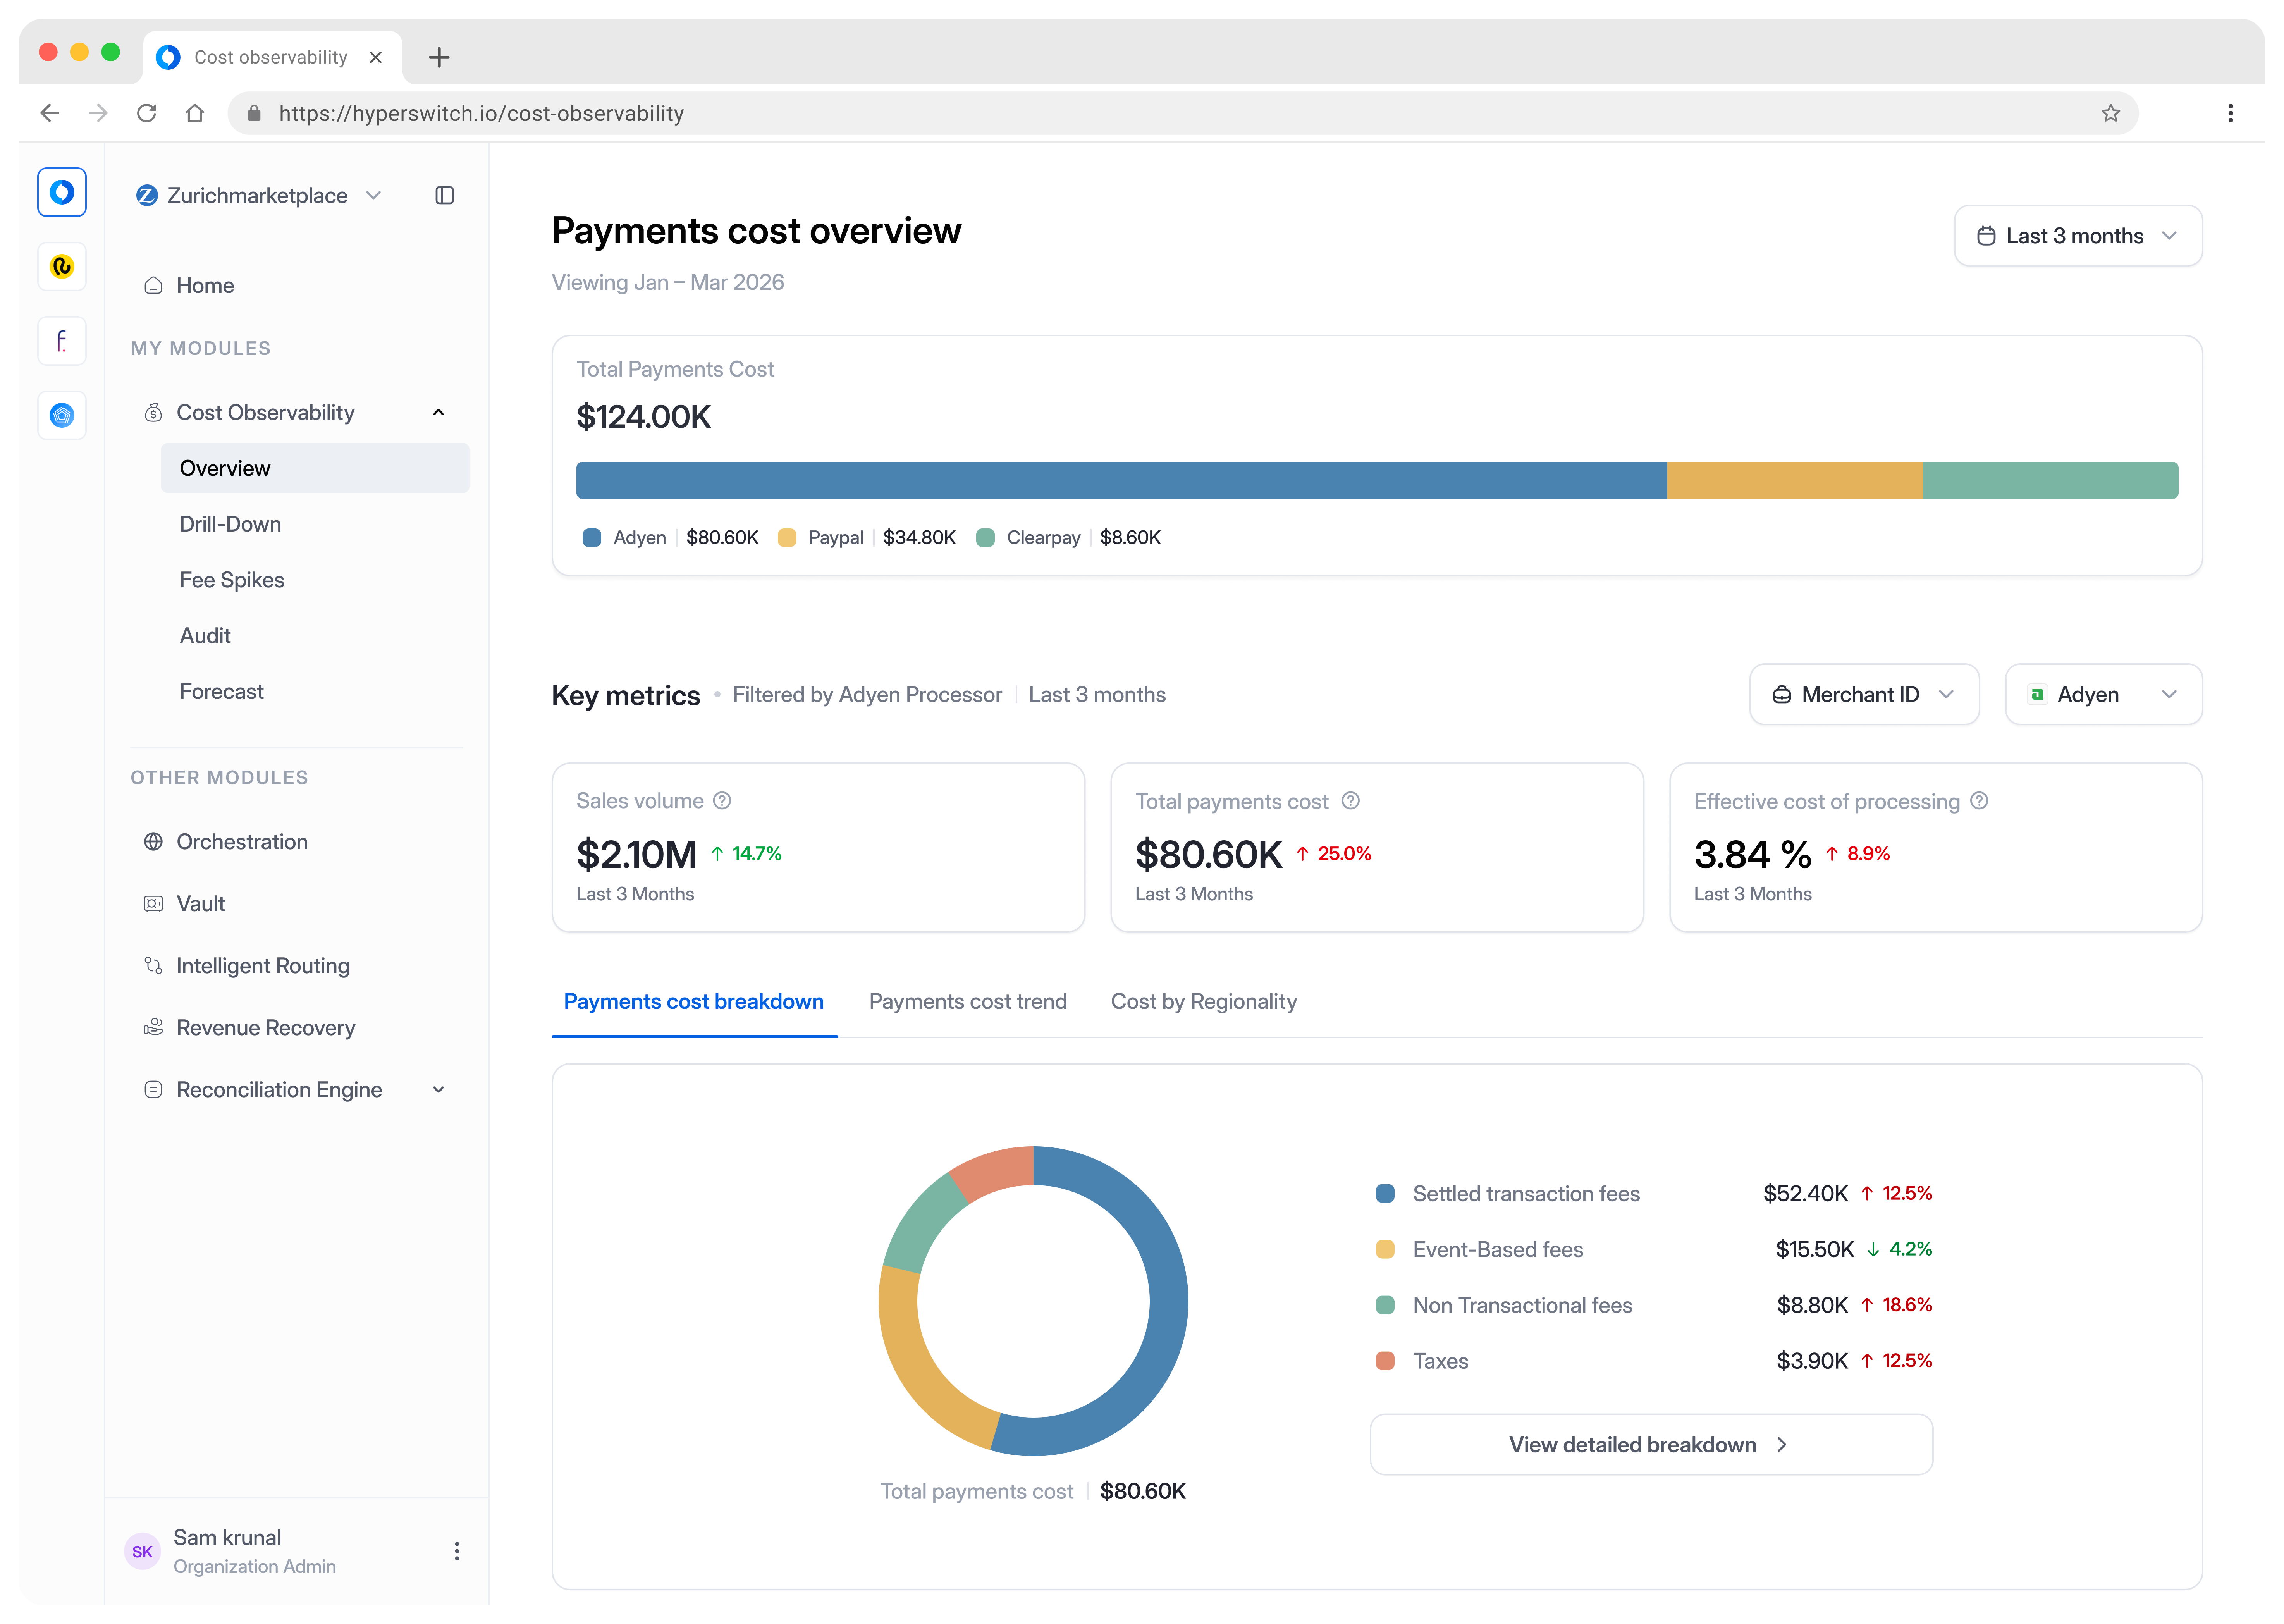
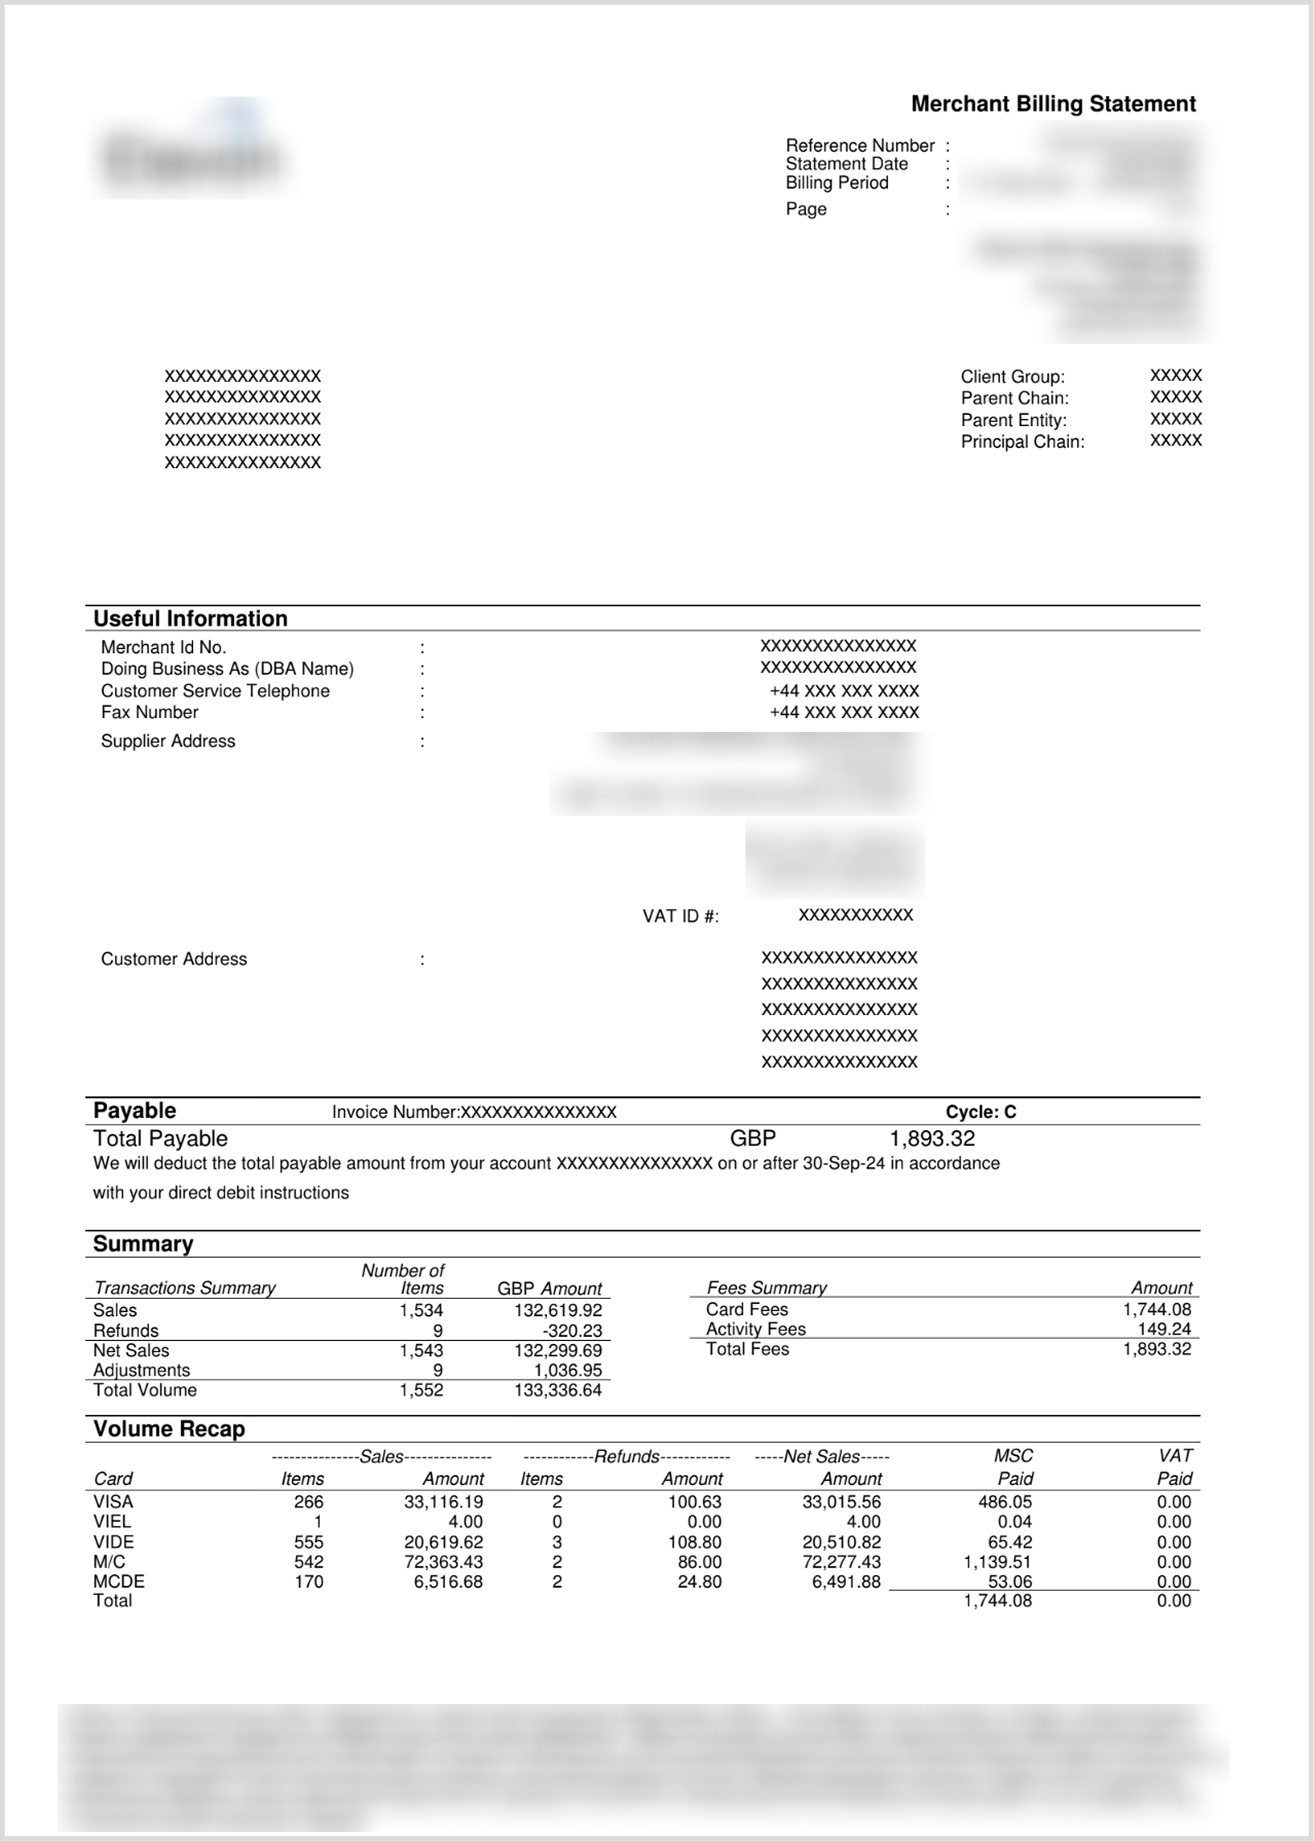
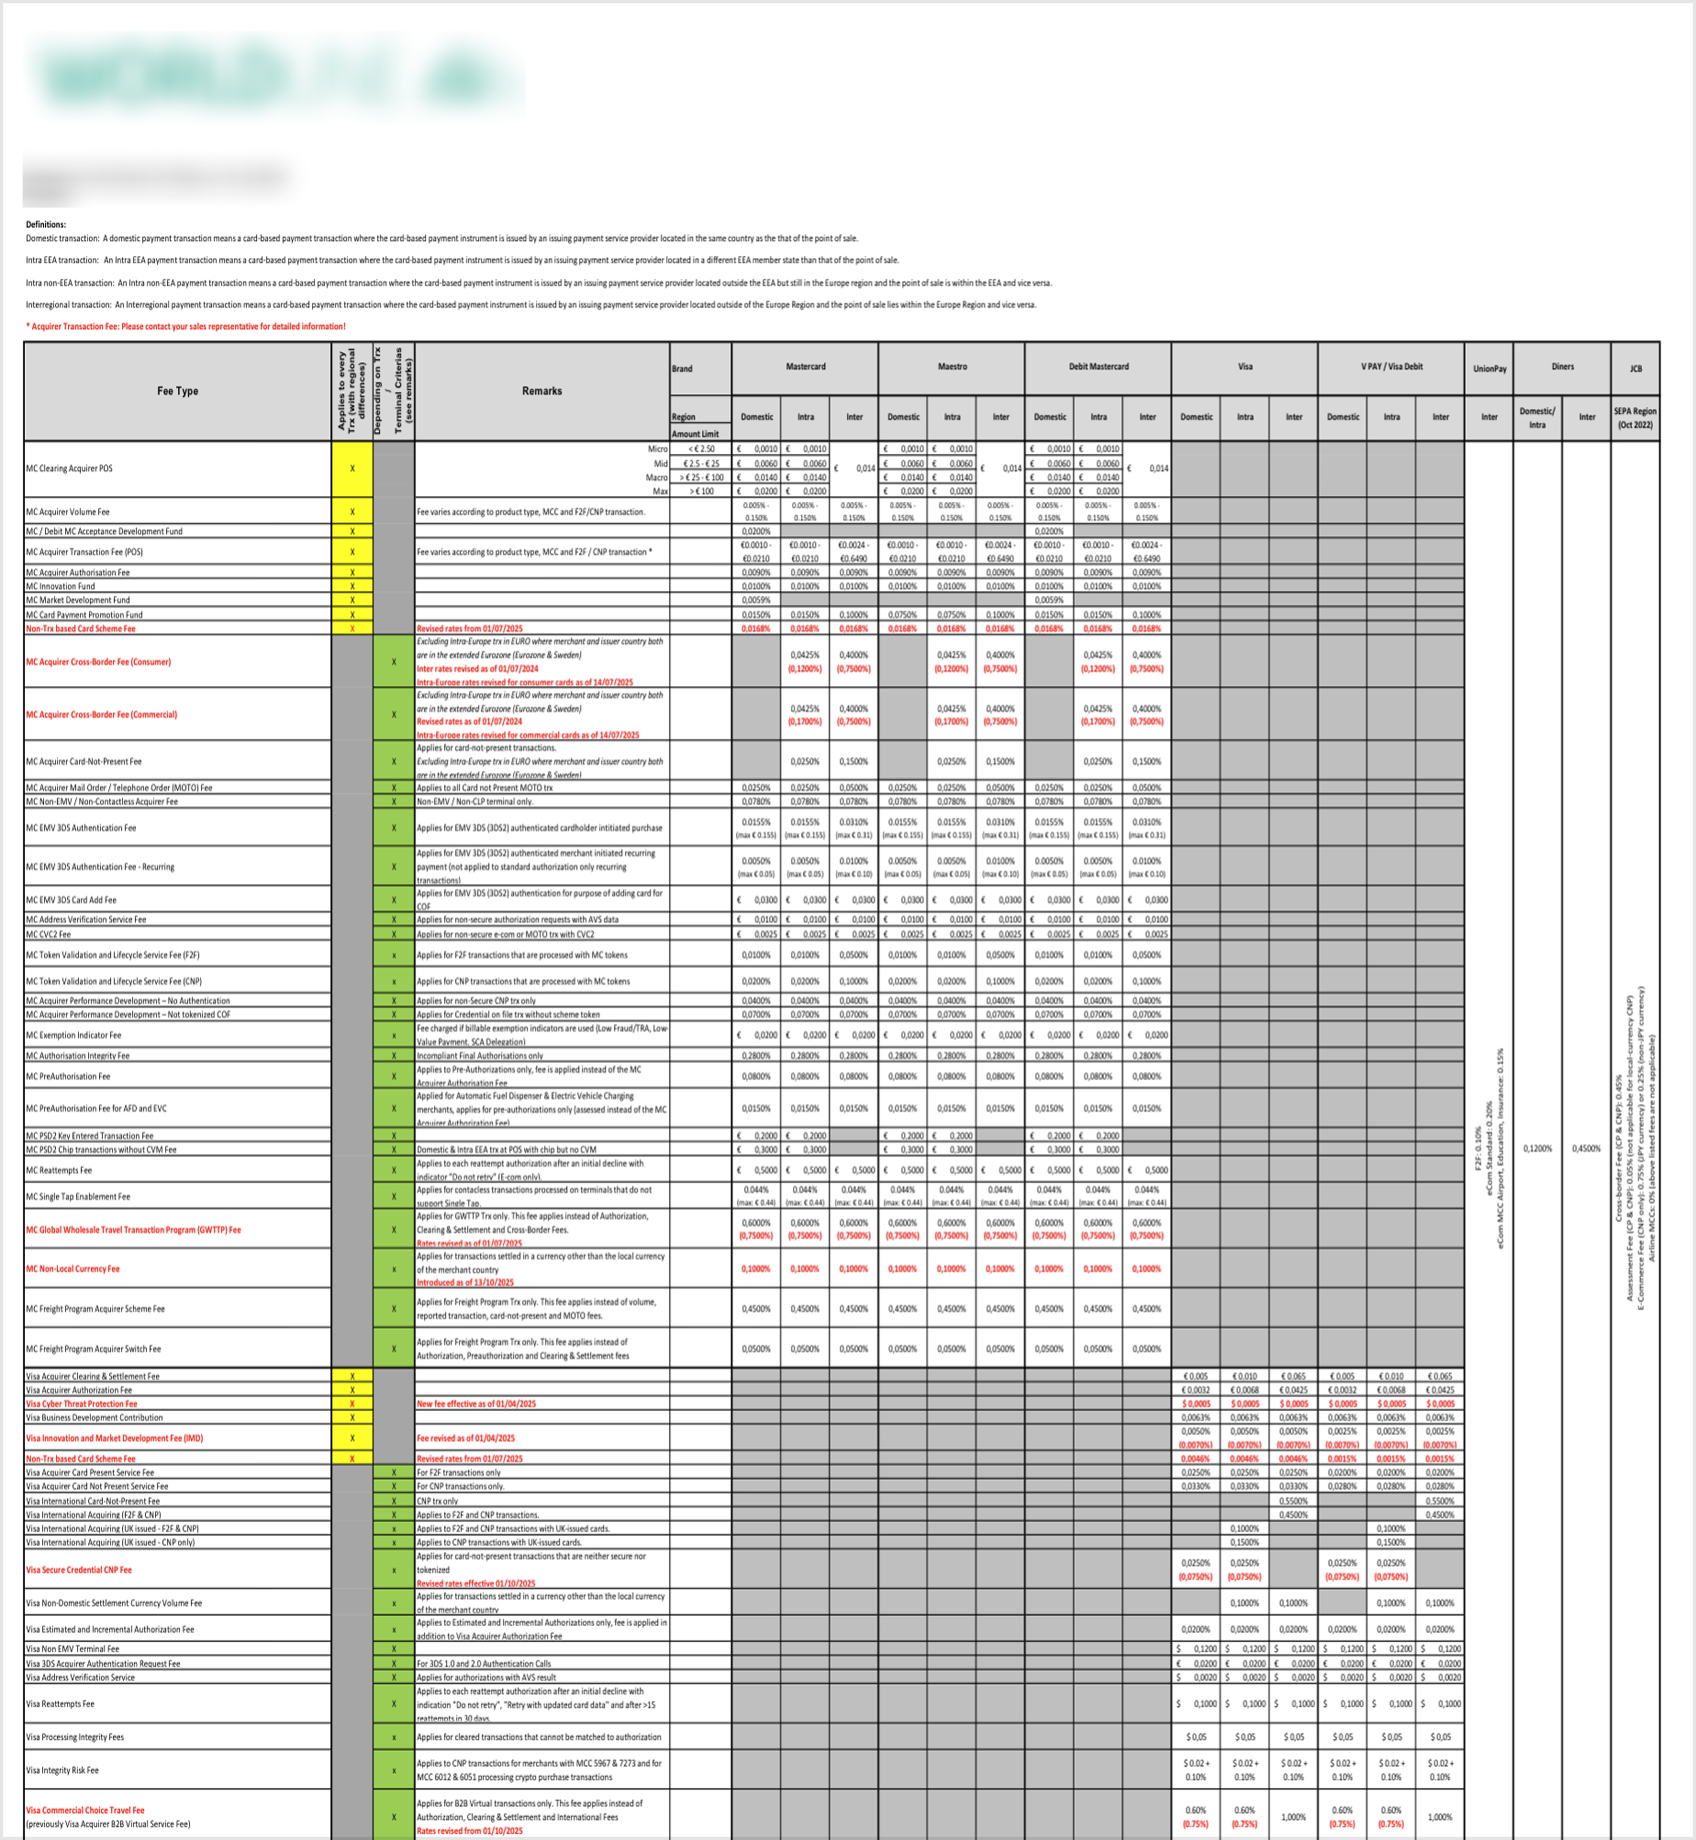
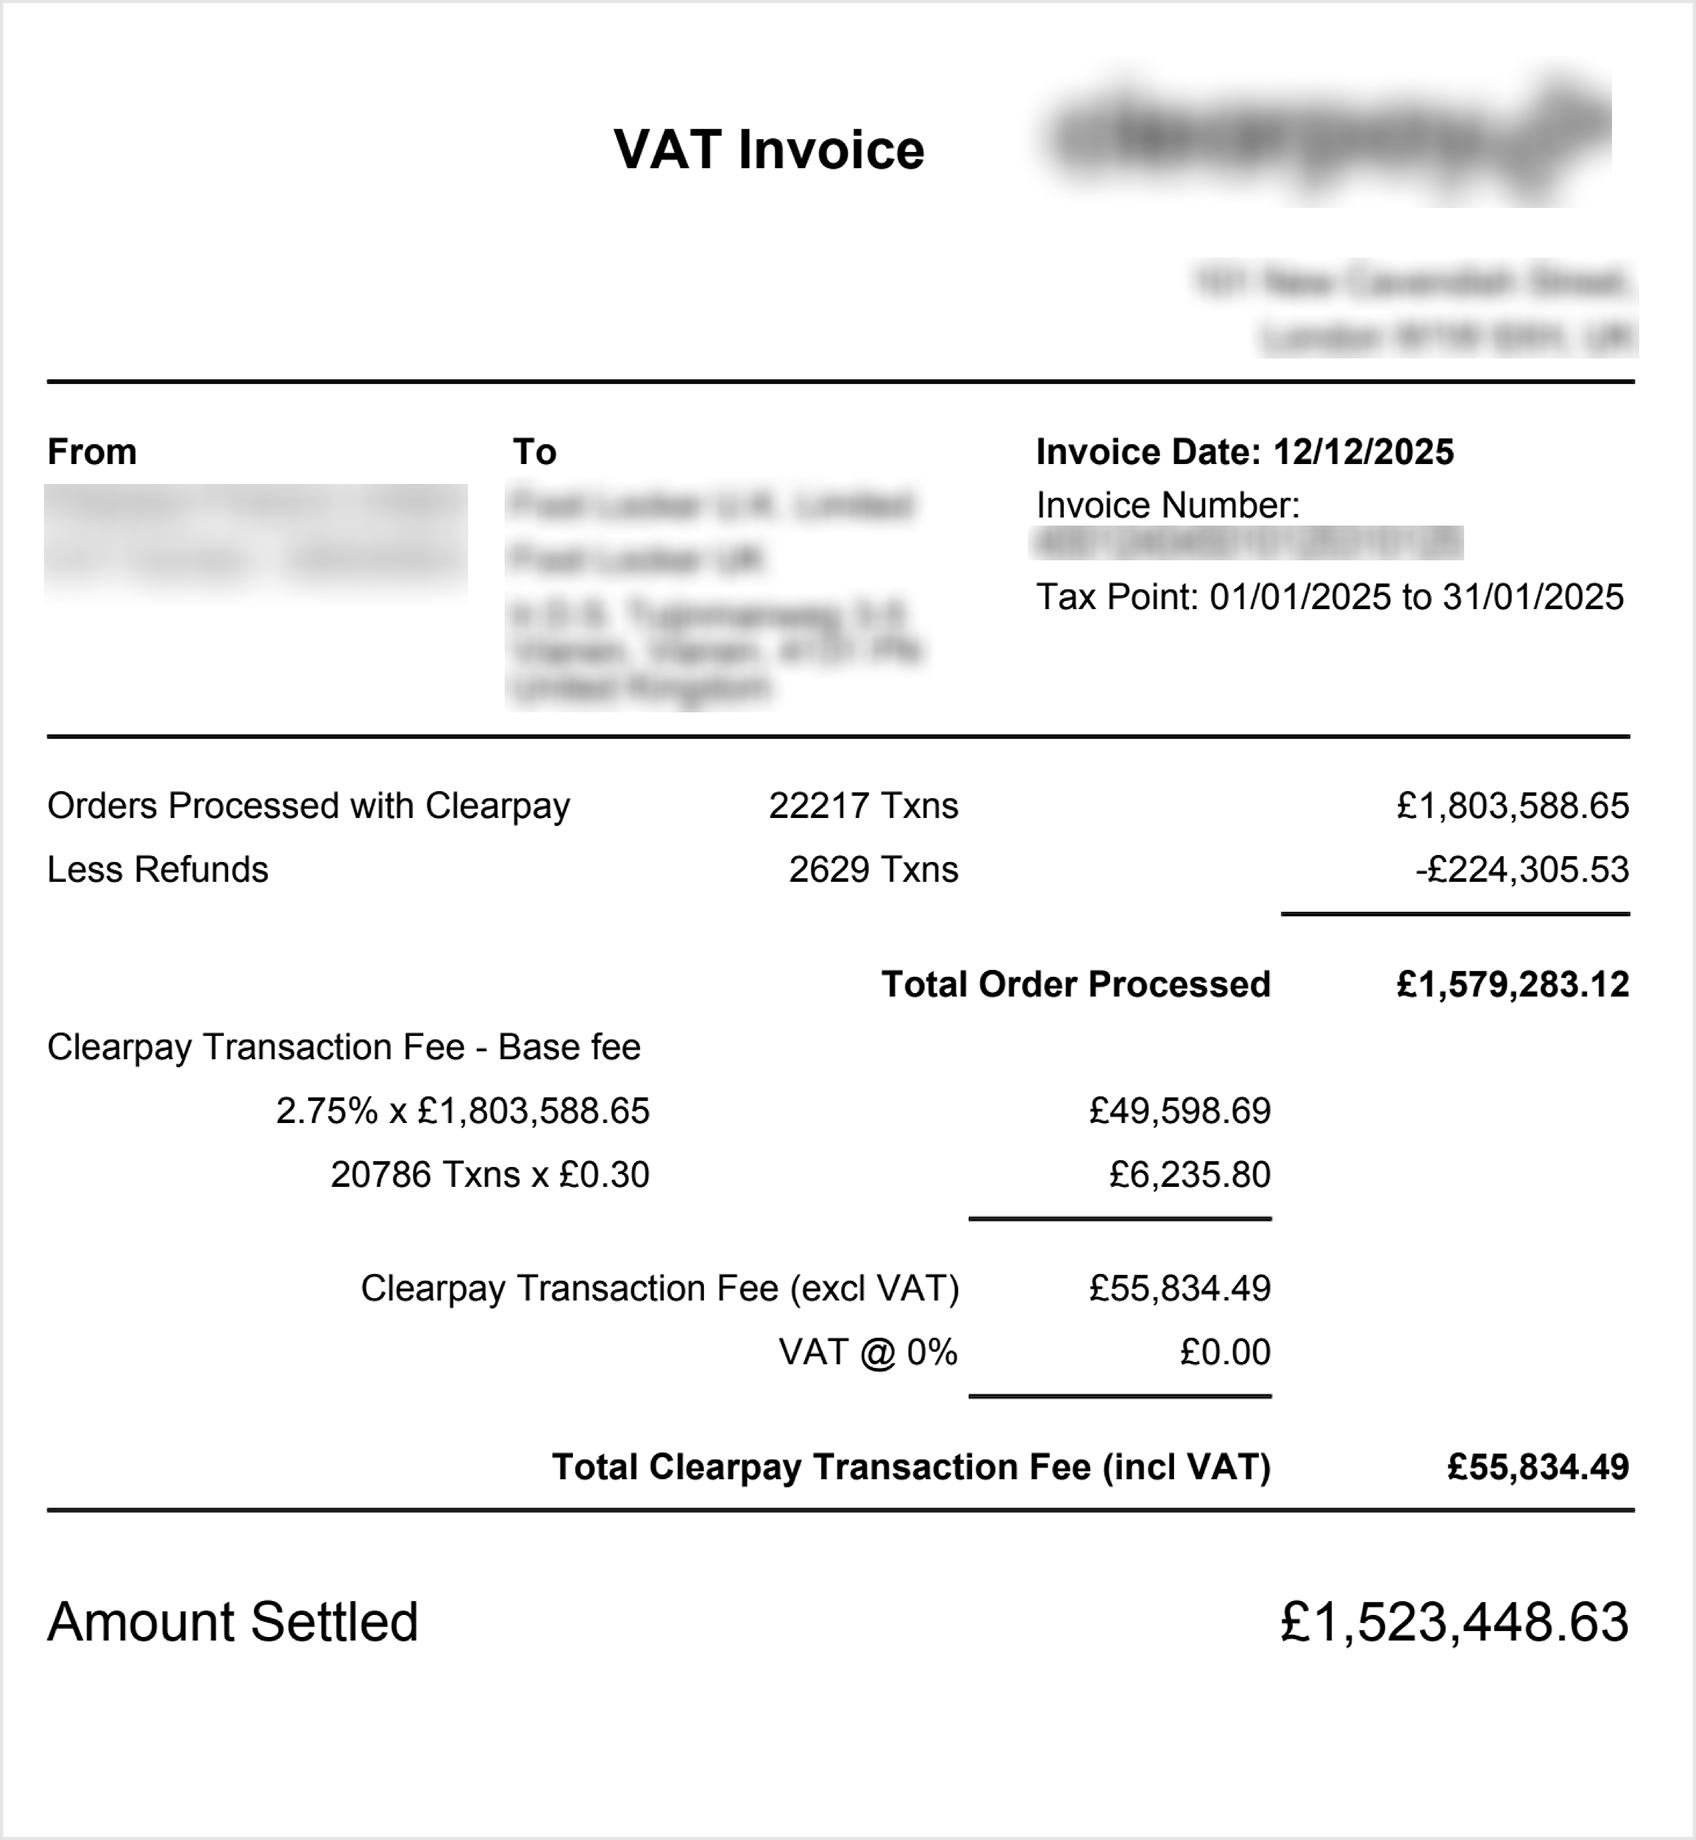
Every payment generates revenue. But not every dollar reaches the merchant.
After building payment infrastructure for enterprise businesses in India for over a decade, Juspay expanded into the US and European markets through Hyperswitch. It exposed us to a very different payments ecosystem, where payment costs were no longer a hidden operational detail but a critical business concern.
Working closely with enterprise merchants in these markets gave us a deeper understanding of how those costs were structured and why making sense of them remained so difficult.
On the surface, payments appear simple. A customer pays, and the merchant gets paid.
In reality, every transaction passes through multiple participants before reaching the merchant, each introducing its own fees and rules. Individually these costs seem small, but at enterprise scale they become one of a merchant's largest variable expenses.
The visibility gap
Merchants knew how much they were paying, but had very little understanding of what changed, why it changed, or where their money was going.
Although payment costs are expressed as small percentages between 1.5–3.5% of their payment volume on processing costs, at enterprise scale they quickly translate into millions of dollars in avoidable spend.
Merchant scale →
Assuming a 2% processing cost
Small merchant
Costs are rarely a priority.
$5M/yr volume → $100K/yr fees
Mid-sized merchant
Costs become noticeable.
$50M/yr volume → $1M/yr fees
Enterprise merchant
Every basis point matters.
$500M/yr volume → $10M/yr fees
/02 This is where Hypersense begins
Making payment costs observable.
HyperSense is a payment cost observability platform built to help merchants understand where their payment costs come from, why they change, and what actions to take next.
It transforms fragmented payment data spread across processor invoices, settlement reports, and transaction logs into a single investigation experience.
My Contribution
As a sole product designer, I worked closely with product, engineering, and business development teams to translate those insights into a cohesive investigation experience for enterprise merchants.
One designer. A team of seven. One shared problem to solve.
Design
Solo Product Designer
UX, product strategy, systems thinking, IA, data visualisation, interaction design.
Product
Product Manager
Problem framing, prioritization, merchant requirements, roadmap, delivery.
The industry's most transparent pricing model comes with an invisible tradeoff.
Every card payment looks simple from the outside: tap, approve, done. But every transaction the merchant processes comes with a payment's cost, and how that cost is calculated depends on the pricing model a merchant chooses.
The industry primarily operates on two models: Blended pricing and IC++ pricing.
Blended pricing applies a single fixed rate to every transaction. It's simple and predictable, but at high volumes, merchants often end up paying more than necessary.
IC++ pricing, on the other hand, charges the actual cost of processing for each transaction, creating opportunities to reduce costs at scale. That's why enterprise merchants prefer IC++.
IC++ fee simulation
Customer Pays
Payment Costs
Merchant Receives
A payment may look like a single event, but it's actually a chain of participants, systems, and decisions, each contributing to the final cost.
The same transparency that creates savings also creates complexity.
In IC++ pricing, no two transactions are guaranteed to be priced the same. Card type, authentication, settlement timing, geography, and data quality all influence the final fee. Each variable can quietly shift a transaction into a different fee tier, and most merchants never see it happen.
Without visibility, enterprise merchants often pay more than they should. The gap between expected and actual payment costs can reach 7–10%.
The raw documents
Payment cost data is fragmented.
Understanding the complete cost story often means piecing together fragmented payment cost data spread across invoices, settlement reports, and network documentation.
Different formats. One cost story.
IC++ fee simulation — select a card type, then run the transaction
Card type
Customer pays
$1,000.00
—
—
/04 Geographic Focus
Why the US and Europe mattered.
The visibility of payment costs varies significantly across markets.
In India, domestic payments largely run on UPI, where transaction costs are minimal. In many Southeast Asian and Latin American markets, merchants operate on simplified or blended pricing models that bundle costs into a single rate.
In contrast, merchants in the United States and Europe often operate on IC++ pricing, where every component of payment cost is exposed individually, creating both transparency and complexity.
Where payment cost visibility matters
IC++ dominant
Simplified pricing
/05 Users
Three users. One blind spot. Different stakes.
Once we understood where the problem existed, we needed to understand who was responsible for solving it. We discovered that payment costs weren't owned by a single team. Three different stakeholders interacted with the same problem from different angles, each carrying a different responsibility, but all missing the same visibility.
The Payment Analyst –Owns the monthly fee audit.
Every month, processor invoices arrive with hundreds of fee line items that need to be reconciled, explained, and defended before the billing cycle closes.
01
Invoice arrives
A $47K cost increase appears on the monthly invoice.
02
Manual investigation
The amount is clear. The cause is buried across invoices and exports.
03
Trail goes cold
Thousands of transactions. Dozens of fee programs. The increase is visible. The cause isn't.
04
Cost becomes permanent
The cycle closes before the answer arrives. The leakage continues next month.
Questions they need answers
What changed?
Which fees need attention?
What should we do next?
Why it matters
Every unexplained fee becomes an accepted cost from the next billing cycle.
The Treasury / Finance Lead –Owns forecasting and budget accountability.
Payment costs are one of the largest variable expenses in the business, often representing 1.5–2.2% of revenue. When those numbers move, finance teams are expected to explain why and predict what happens next.
01
Variance detected
Payment costs increased 13% quarter-over-quarter. The CFO wants an explanation.
02
Manual investigation
The increase is visible. The cause is scattered across invoices, reports, and rate updates.
03
Too many possibilities
Growth, network changes, or processor errors. No clear way to separate signal from noise.
04
Planning in the dark
Planning the next quarter without understanding what drove the last one.
Questions they need answered
What's driving the increase?
Which costs are expected vs avoidable?
What should we plan for next quarter?
Why it matters
When cost increases can't be explained, finance can't tell the difference between growth, leakage, and operational issues.
The Payment Operations Head –Owns the operational decisions that influence payment costs.
Routing rules, authentication settings, and processor configurations all influence payment costs. But their impact often appears weeks later, long after the decision was made.
01
An optimisation ships
A routing, authentication, or checkout change ships to improve conversion, acceptance, or reliability.
02
The signal arrives late
The change succeeds. The cost impact appears weeks later through settlement and billing.
03
Cause becomes unclear
Multiple releases, processor changes, and network updates happened in between.
04
The next release ships
Teams keep optimising while the previous cost impact remains unresolved.
Questions they need answered
Which decisions affected payment costs?
Are those costs expected or avoidable?
What should be corrected before the next release?
Why it matters
Without a clear feedback loop, teams keep optimising while every unexplained cost increase becomes recurring spend.
By this point, we understood the ecosystem. The challenge was turning a fragmented payment system into a coherent cost story that different teams could trust and act on. While each team entered from a different perspective and carried different responsibilities, they were ultimately trying to answer the same question: where payment costs were coming from and what to do about them.
/06 Product Strategy and Design
From fragmented signals to one investigation.
Payment cost systems are naturally fragmented. Organising the product around processors, fee types, or reports would simply mirror that complexity.
Instead, we looked at how investigations actually unfolded. Regardless of where teams started, they were all trying to answer the same core questions.
That insight shaped the product strategy.
One investigation. Multiple questions.
We designed the product around how teams investigate costs. Rather than asking teams to manually piece together fragmented reports, each module guided them toward the answers they needed: from understanding what changed to deciding what to do next. Together, they form a coherent cost story that teams could trust and act on.
/07 Design Challenge
Five tensions that shaped every design decision.
Defining the investigation flow solved the product problem. Designing an experience around it introduced a new set of constraints.
Every decision now had to balance trust, flexibility, and depth, without breaking the investigation flow.
01
One cost story from fragmented systems
Cost investigations required teams to piece together answers from multiple disconnected systems, reports, and invoices before they could understand what was happening.
Consolidate fragmented cost data into a single workflow that supports end-to-end investigation.
02
Making complex cost data trustworthy
Payment teams were expected to make operational and financial decisions from data they couldn't easily verify or explain.
Complex cost data⇄Confidence to act
Design response
Present cost intelligence in a way that feels transparent, explainable, and trustworthy enough to drive decisions.
03
One interface, two pricing models
The same product needed to serve merchants operating on fundamentally different pricing structures and levels of cost visibility.
IC++ granular detail⇄Blended single rate
Design response
Create a unified experience that adapts to both transparent IC++ pricing and simplified blended pricing.
04
Distinguishing growth from leakage
Not every increase in payment costs is a problem. Some reflect healthy business growth, while others indicate preventable leakage.
Expected cost movement⇄Preventable leakage
Design response
Help teams distinguish normal cost behaviour from issues that require investigation and action.
05
One investigation for multiple teams
Finance, Payments, and Operations teams approached the problem from different angles, but every investigation needed a shared understanding of what changed and why.
Different stakeholder goals⇄Shared investigation
Design response
Support different workflows while keeping every team aligned around the same cost narrative.
/08 Product Experience
From fragmented costs to a single cost story.
With the investigation flow established, the next challenge was turning it into a cohesive product experience.
Each module served a distinct purpose, but together they needed to feel like a single investigation that teams could navigate naturally every month.
Overview
What's my cost story at a glance?
Before teams investigate anomalies or optimize costs, they first need to understand where they stand today.
We designed Overview as the system's source of truth: a unified cost layer that consolidates fragmented signals into a single cost story.
The same experience needed to work across very different merchant realities, from single processors to multi-PSP setups, and from simplified blended pricing to fully transparent IC++ models.
Before any investigation begins, teams need answers to three questions:
What changed?
What am I paying today?
Where should I investigate first?
Drill-Down
How is cost distributed across my business?
Overview answered what the cost story looks like at a glance. The next step was understanding where that story was coming from.
A single number rarely explains why costs change. Teams needed the ability to break costs down across processors, regions, corridors, fee types, and currencies.
Drill-Down became the investigation layer of the product, helping teams move from cost summaries to the underlying drivers behind them.
Teams needed the flexibility to investigate costs from different angles without getting lost in the underlying complexity.
We designed Drill-Down to answer three questions:
Why did costs change?
Which segment is driving the change?
How much impact is it creating?
Fee Spikes
Turning unexpected cost increases into actionable signals
Drill-Down helped teams understand where costs were coming from. The next challenge was determining whether those changes were expected or required action.
Not every increase in payment cost is a problem. The same spike could be driven by healthy sales growth, expansion into new markets, operational issues, or preventable leakage.
Fee Spikes was designed as an early warning layer that surfaces meaningful cost changes and explains what is driving them.
Every spike ultimately comes down to three questions:
What changed?
What is driving it?
Does it require action?
Audit
Verifying every fee charged.
Fee Spikes helped teams identify where action was needed. The next step was validating whether they had been charged correctly in the first place.
Processor invoices show what was charged, but rarely explain whether those charges were accurate.
What merchants actually see
CPS Retail — $4,892
EIRF — $2,147
The challenge was bringing together multiple layers of information (contracted rates, applied rates, fee variances, and transaction-level evidence) into a single verification flow.
Every audit ultimately comes down to three questions:
Was I charged correctly?
What was actually charged?
What should it have been?
Instead of forcing teams to manually reconcile invoices, contracts, and transaction exports, the experience progressively moved from summary-level variances down to transaction-level evidence, making every discrepancy traceable and easy to defend.
Forecast
Turning network updates into cost foresight
Card networks like Visa and Mastercard regularly introduce new fees, revise existing programs, and update qualification rules. Although these changes are published weeks in advance, they are often buried inside dense technical documentation.
For merchants, the challenge wasn't access to information. It was understanding which updates would actually affect their business and what their financial impact would be. Without that visibility, teams often discovered the impact only after it appeared on the following month's invoice.
We designed Forecast to translate network updates into merchant-specific insights by modelling upcoming changes against each merchant's transaction behaviour.
It helps teams answer three questions:
What changes are coming?
What will the impact be?
What should we do next?
With Forecast, the investigation no longer ended with understanding what happened. Teams could start preparing for what happens next.
/09 Outcome
From a concept to real merchant traction.
HyperSense evolved from an internal concept into a product validated by enterprise merchants.
Through demos, pilots, and customer conversations, we confirmed that payment cost visibility wasn't just an operational problem; it was a business-critical one worth solving.
20+
Demoed
Presented to 20+ enterprise merchants, includes Apple, SpaceX.
6
Piloted
Piloted with 6 merchants using real payment cost data.
2
Converted
Two pilot merchants moved into commercial engagements.
What's next
While HyperSense began as a merchant-facing observability product, the investigation uncovered a larger opportunity upstream.
Many of the cost decisions that merchants struggle to understand originate within banks, processors, and network programs.
We're now applying the same principles of cost visibility and intelligence to financial institutions, helping them understand and manage payment costs.
Thank you for taking the time to follow the journey.